Study shows that Minnesota has created lowest number of new businesses in the nation.
I’m not sure how I missed posting this earlier, but in late April the Kauffman Foundation released its annual Index of Entrepreneurial Activity for 2012.
So how did our home state of Minnesota fare? In short, dead last. Minnesota came in with the lowest entrepreneurial index of any state in the union. According to the study, only 150 people per 100,000 adults started a new business each month.
Minnesota vs. Upper Midwest
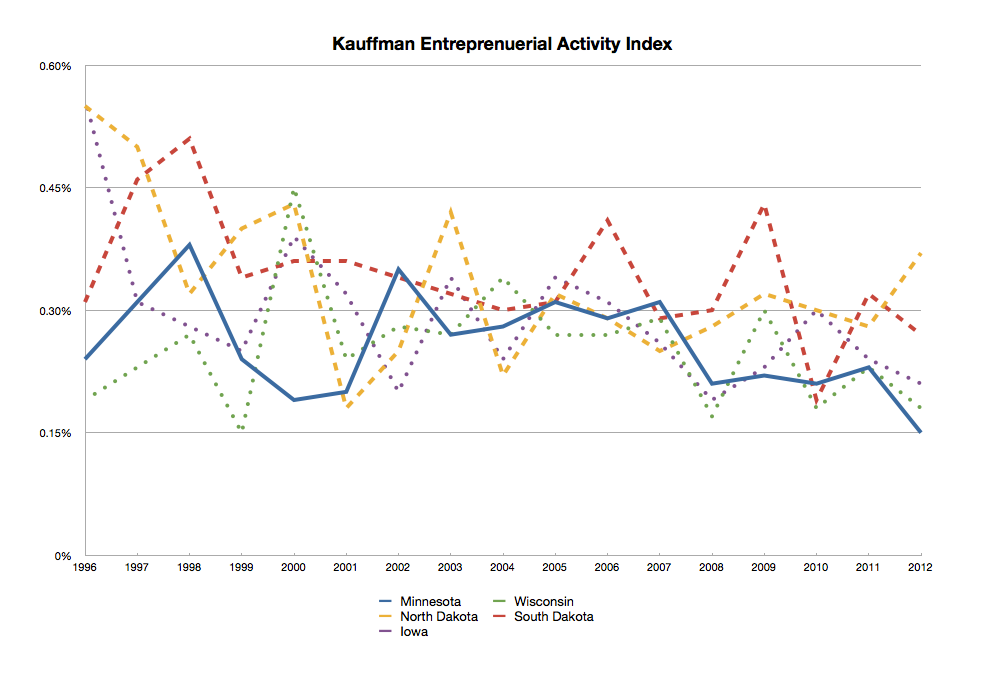
I took a look at the other states in the Upper Midwest to see how Minnesota compares and put them in the chart below.
North Dakota handily had the highest rate in the Upper Midwest at 0.37% thanks to the oilfield boom. South Dakota registered a respectable 0.27%. Iowa was in the middle of the 5 states and has 210 people per 100,000 adults starting new businesses each month. Minnesota and Wisconsin, however, were in bottom 5 states with Wisconsin registering a 0.18%, followed by Minnesota at 0.15%.
National Results
In 2012, the top 5 states creating new businesses were:
- Montana – 0.534%
- Vermont – 0.524%
- New Mexico – 0.522%
- Alaska – 0.431%
- Mississippi – 0.425%
I was utterly shocked to see that list. When I think of hotbeds of new business creation, I’m not thinking of Helena, Montpelier or Santa Fe. This list goes to show how our intuition can be so wrong.
Comparing The Top States for New Businesses
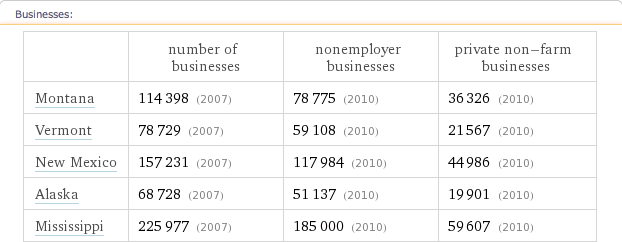
I did a quick little comparison in Wolfram Alpha to see how the top 5 states compare as far as number of businesses, ownership by gender and race, etc. You can click on the image for more info.
I also built a little interactive widget in case you want to compare your state (as I did with Minnesota) to one of the top 5 states. If the widget below doesn’t load, click through to the widget here.
The report has a lot of tables and charts with nice breakouts of entrepreneurial activity by:
- gender
- race (spoiler: Latinos are killing it with 19.5% of all new entrepreneurs)
- native-born / immigrant (immigrant rate has nearly doubled in 16 years)
- age brackets
- education level (Less than HS, HS Graduate, Some College, College Graduate)
- veteran status
- industry group (Construction, Manufacturing, Trade, Services, Other)
- region (Northeast, Midwest, South, West)
If you’re a visual person, the Kauffman Foundation has a nice interactive map. If don’t have the time to dig through the meat of the report, the Star Tribune has a good summary. For those with some time on your hands, you can look through the full report here.


